
Main KPI dashboard
Review weekly performance using clear KPI cards, trend visuals and operating status indicators.
Track weekly sales, labour cost, food cost, prime cost, covers, average spend and performance trends in one practical Excel dashboard.
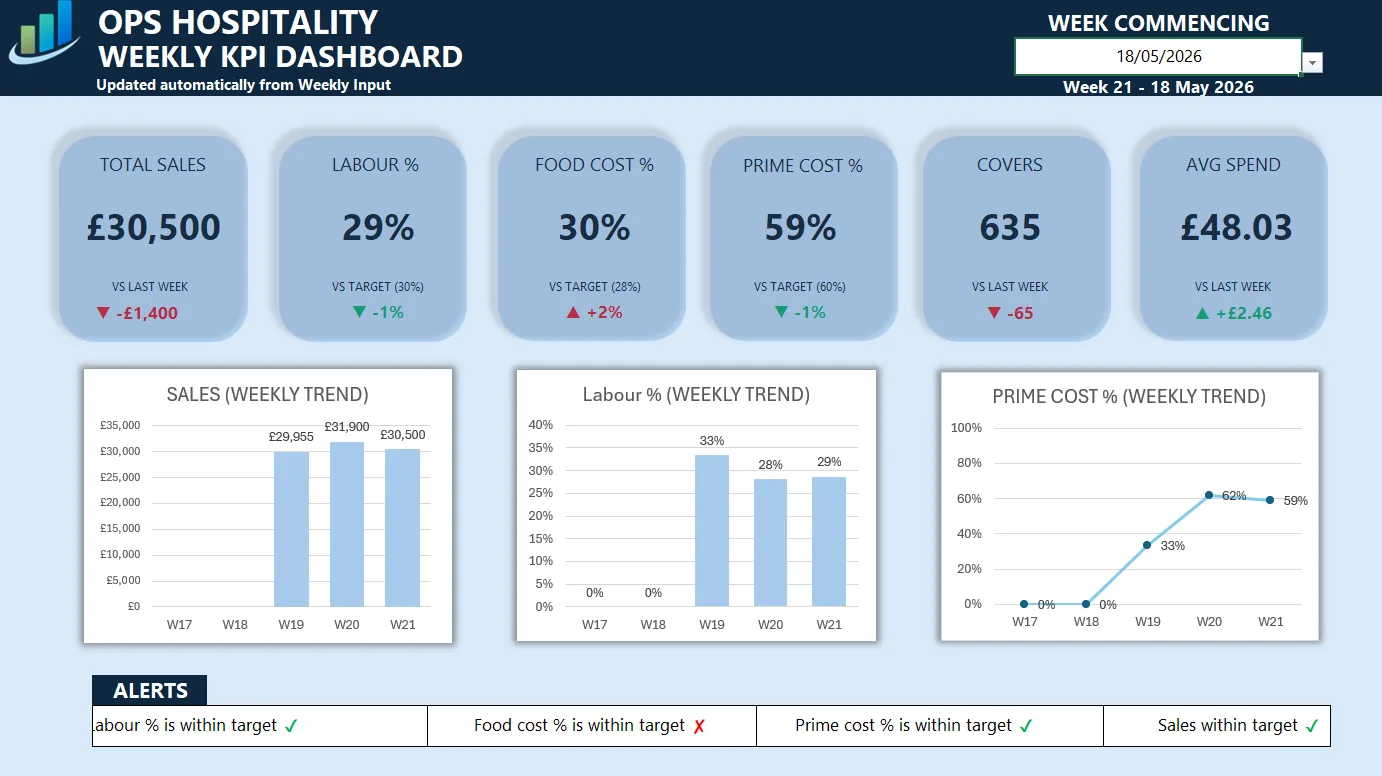
The Weekly KPI Dashboard helps managers and operators track the numbers that explain weekly performance, cost pressure and operating direction.
It is built for hospitality teams, restaurants, cafés and bars, but the structure can also support other small businesses that need a simple weekly KPI system without complex software.
This Excel dashboard gives managers a simple way to review weekly sales, labour, food cost, prime cost and operating performance without building a reporting system from scratch.
Review weekly performance using clear KPI cards, trend visuals and operating status indicators.
Set KPI targets and compare actual performance against labour, food cost, prime cost and profitability goals.
Enter weekly sales, covers, labour cost, food cost and performance data in a structured format.
The workbook includes connected sheets for KPI input, targets and dashboard review, helping managers turn weekly numbers into clearer operating decisions.
Review weekly performance at a glance with sales, labour, food cost, prime cost and trend indicators.
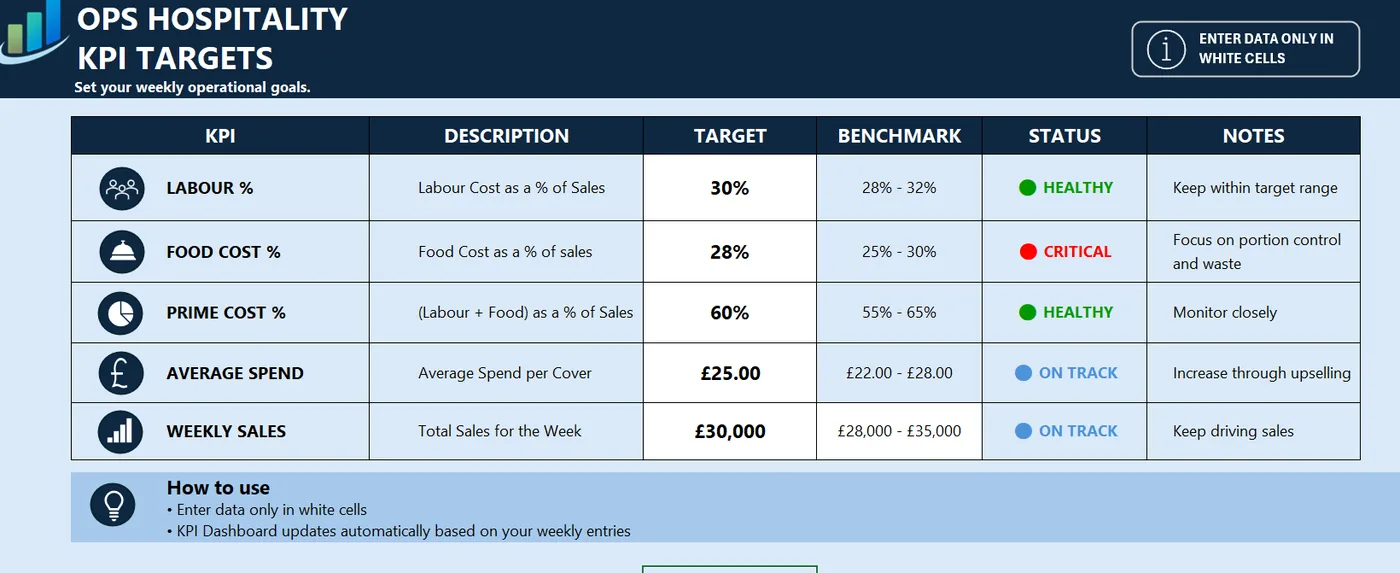
Set performance targets and use simple status indicators to spot which areas need attention.
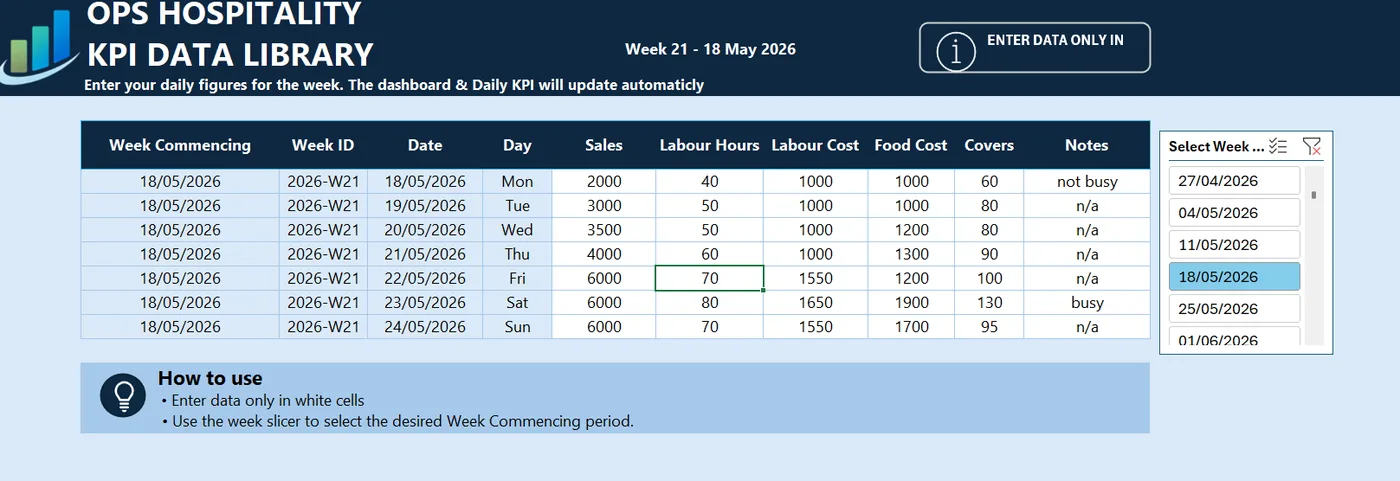
Enter weekly data in one structured place so the dashboard can support consistent performance reviews.
This dashboard is designed for restaurants, cafés, bars, hotels, F&B teams and hospitality operators that want to review weekly performance without relying on scattered spreadsheets.
It can also be adapted by other small businesses that need to track weekly sales, cost pressure, targets and operating performance in Excel.
Use this dashboard alongside Ops Hospitality calculators and guides to review weekly performance, prime cost, profitability and operating pressure.
No. The Weekly KPI Dashboard is a paid Excel dashboard available through Gumroad.
No. It is built with hospitality operations in mind, but the structure can be adapted by other small businesses that track weekly sales, labour, costs and performance targets.
The workbook is designed for Excel. You may be able to upload it to Google Sheets, but some formatting, formulas or dashboard behaviour may vary.
The dashboard helps track weekly sales, covers, average spend, labour cost, food cost, prime cost, profitability indicators and performance trends.
Start reviewing weekly sales, labour, food cost, prime cost and performance trends in one Excel dashboard.