
Profitability
Based mainly on net profit percentage and whether the business is making or losing money.
Use this restaurant profitability score calculator to check your business health across profitability, cost pressure, payment coverage and operating efficiency. Get a clear score, pressure diagnosis and recommended next action.
Use weekly or monthly figures. Keep sales, food cost, labour cost, fixed costs and operating costs from the same period.
Payments due in the next 7–14 days are real payments that will leave the business soon, such as supplier invoices, payroll, rent or lease, tax, utilities, stock or inventory orders and finance payments.
Do not automatically add all costs again unless they are actually due for payment soon. Costs measure the period. Payments due measure short-term cash leaving the business.
Payment coverage is calculated as cash available now plus positive net profit, divided by payments due soon. If net profit is negative, it is not added.
The final score combines profitability, cost pressure, payment coverage and operating efficiency. A severe issue in one area can limit the overall score even if other areas look healthy.
Calculating...
Calculating...
Calculating...
Calculating...
This restaurant profitability score calculator does not rely on one single average. It separates restaurant performance into four practical areas: profitability, cost pressure, payment coverage and operating efficiency. If you want to compare your net profit percentage against realistic benchmarks, read this guide to a good restaurant profit margin.
Based mainly on net profit percentage and whether the business is making or losing money.
Based on food cost, labour cost, prime cost and fixed cost pressure.
Based on cash available now plus positive net profit compared with payments due soon.
Based on sales per labour hour and average spend, helping show whether the operation is productive enough for its cost base.
The final score also applies safety caps. If one area is very weak, the total score cannot stay artificially high.
The scanner does more than calculate percentages. It translates your numbers into a simple operating profile, so you can quickly understand the main risk behind the score.
The business looks stable across profitability, cost pressure, payment coverage and operating efficiency.
The business may be making profit, but upcoming payments could still create short-term cash pressure.
Profit may still exist, but food cost, labour cost, prime cost or fixed costs are putting pressure on the operation.
Sales per labour hour or average spend may not be strong enough for the current cost base.
The Restaurant KPI Calculator helps you calculate specific metrics such as food cost percentage, labour cost percentage, prime cost and net profit.
This restaurant profitability score calculator turns those numbers into a clearer business health diagnosis: what is healthy, what is under pressure and what should be reviewed next.
Best use: use the KPI Calculator for detailed metric calculations, then use this profitability score calculator before a weekly management review.
Review break-even sales, operating costs, pricing, sales mix and weekly management actions.
Review recipe costing, rota planning, supplier prices, overtime, waste and prime cost.
Review supplier payments, payroll, rent or lease, tax, stock and upcoming commitments.
A score is only useful if it leads to action. Use this tool before your weekly management meeting to identify whether the biggest issue is profitability, cost pressure, payment coverage or operating efficiency.
Then use the Weekly Restaurant Management Review Checklist to turn the result into practical next-week actions.
A restaurant profitability score calculator is a diagnostic tool that helps operators understand whether profitability, cost pressure, payment coverage or operating efficiency is creating risk.
Yes. The tool calculates a restaurant profitability score, but it also works as a business health scanner by checking cost pressure, payment coverage and operating efficiency.
Not always. Costs measure a trading period. Payments due in the next 7–14 days measure money that will leave the business soon. Do not add all costs again unless they are actually due for payment soon.
Payment coverage is calculated as cash available now plus estimated positive net profit, divided by payments due in the next 7–14 days. If net profit is negative, it is not added to cash available.
Yes. You can enter your own currency, cost structure and operating assumptions. The score is based on percentages and operating pressure, not country-specific tax rules.
Once you know where the pressure is, use a practical template to turn the diagnosis into weekly action. These Excel templates help you track labour, forecasting, KPI performance and management decisions more consistently.
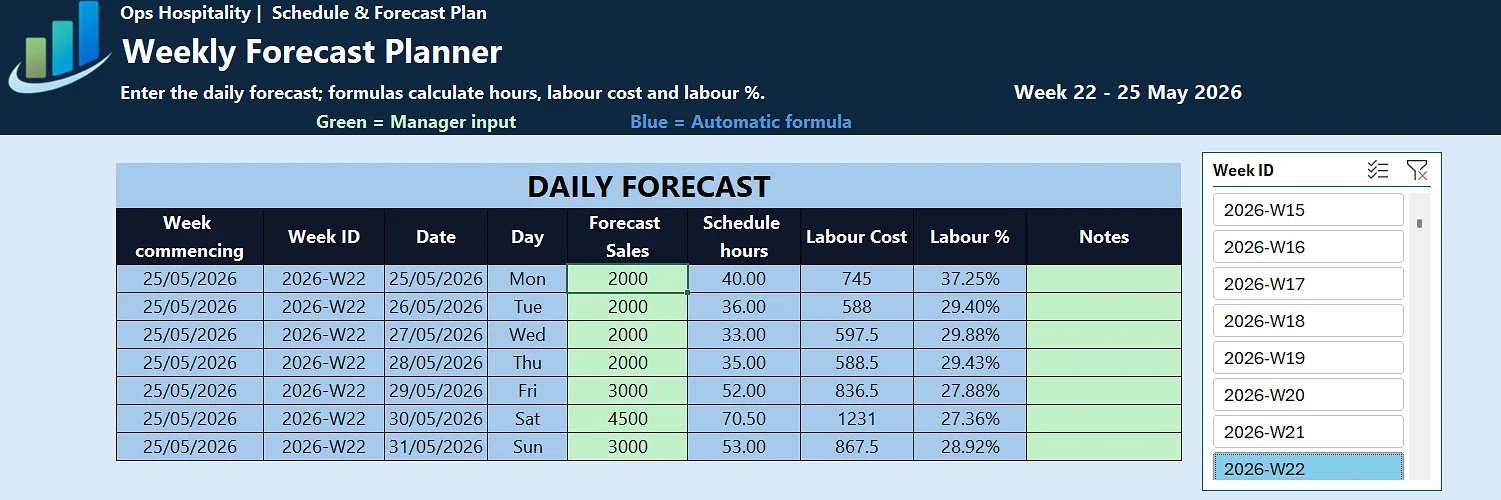
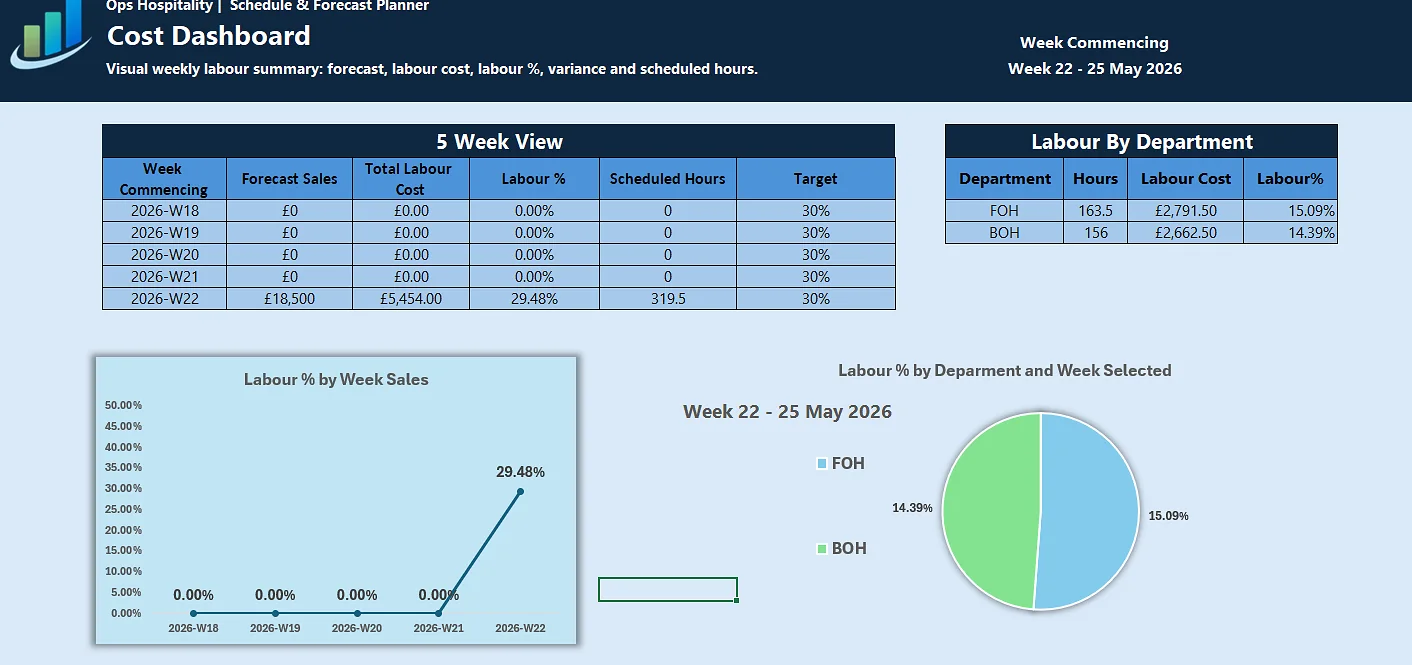
Use this planner if your score shows labour cost pressure, weak sales per labour hour or poor rota alignment. It helps connect staffing decisions with forecasted sales, scheduled hours and labour cost.
View Schedule & Forecast Planner →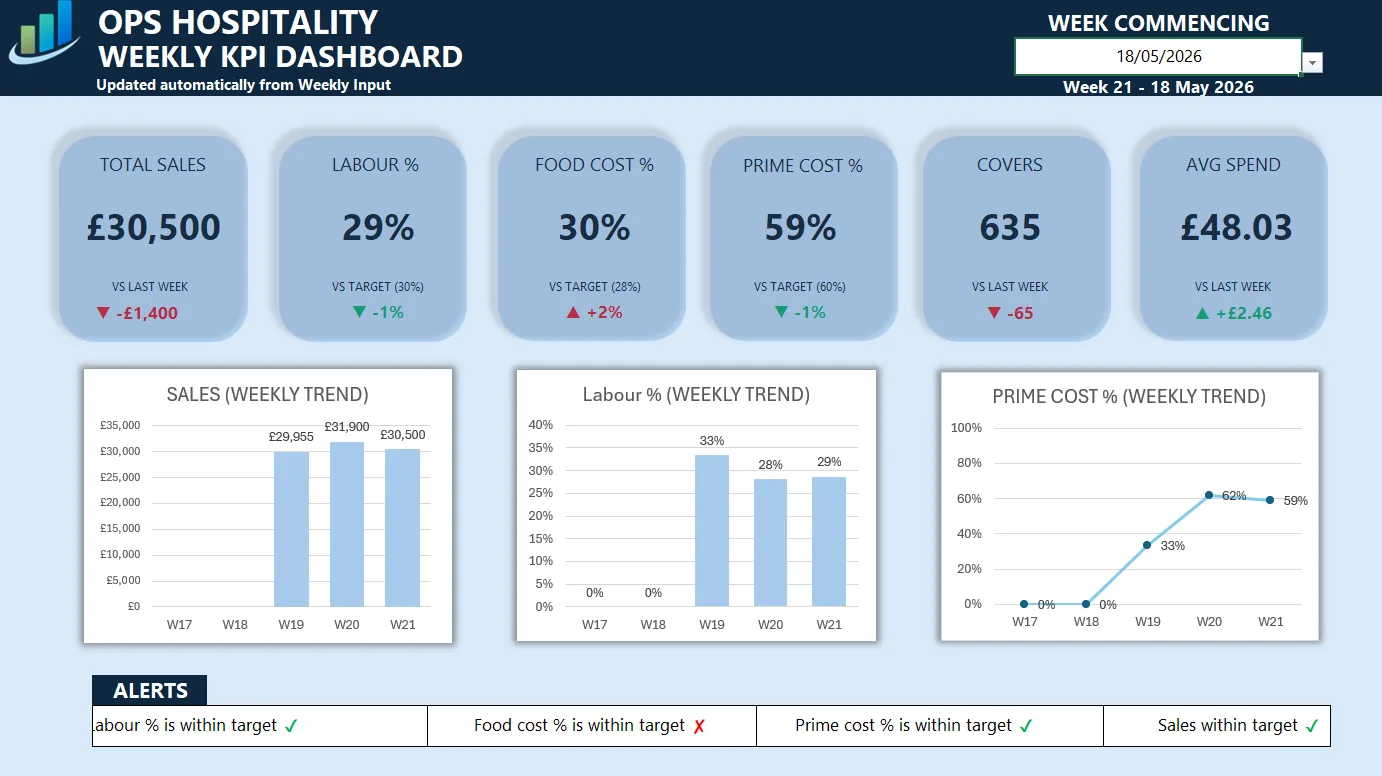
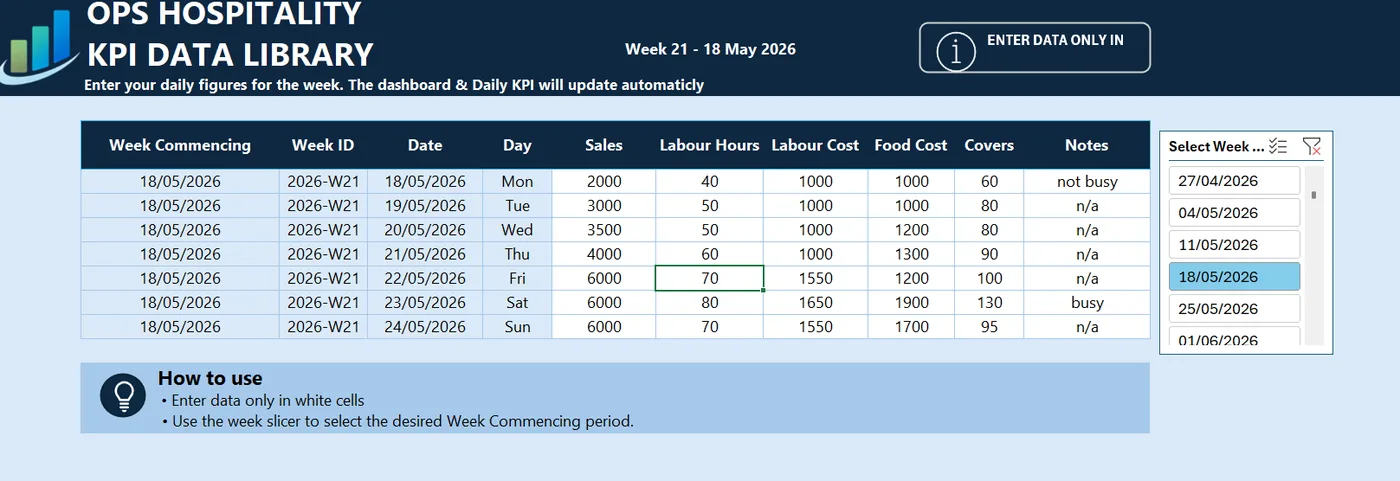
Use this dashboard if you want to track sales, labour cost, food cost, prime cost, covers, average spend and weekly performance after checking your profitability score.
View Weekly KPI Dashboard →After checking your restaurant profitability score, use the Ops Hospitality tools to review labour cost, food cost, break-even sales, payment coverage and weekly management actions.